Darlinghurst Liverpool Street Web Project
We acknowledge the Aboriginal people as the Traditional Owners of this land, and pay our respects to Elders past and present. Working from Darug and Gadigal land.
A visual web project representing historical data mapping the changes of Darlinghurst’s Liverpool Street.
Contents
1. The team
| Human | Role |
|---|---|
| Nicole Cama | Project Lead – professional historian specialising in public history who led this project, provided archival images and conducted all the historical research for this project |
| Nick Clark | Software Engineer – created the site from the ground-up and provided the base for SASS styling |
| Me! | Lead Designer – digitising archival maps, graphic and web design, and SASS styling site-wide |
2. The brief
From the first briefing email, Nicole provided me with a clear outline and attached a detailed brief along with some images for the vibe of the site:
...a data visualisation project mapping the people and structures of Liverpool Street, Darlinghurst based on a particular historical source dating from 1845 to 1948. [...] a website which will creatively illustrate the data from this source using graphics, media and other interactive strategies.
3. The problem
“How can we visualise a whole century of historical data for a modern, general audience?”
- How can we avoid information fatigue?
- How do we tie together information from separate time periods?
- Can we incorporate archival images?
4. Solving the problem
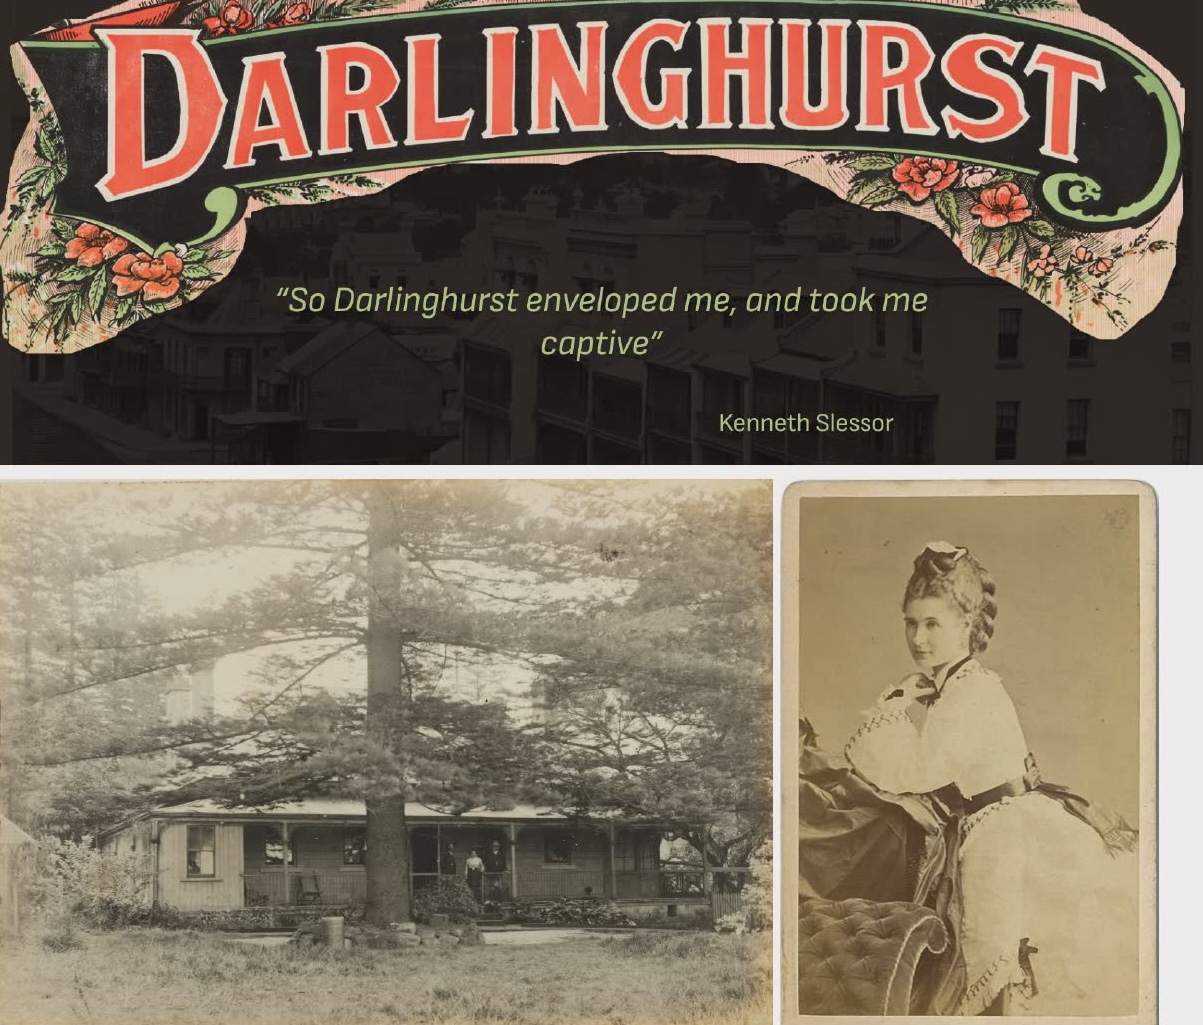
We started off the design process with some mood-boards and brainstorming. Below is a mood-board that Nicole had included in the project brief, which had some archival images that set the tone of how the project might look and feel. These images are in the public domain and some were used as visual assets in the final project.
Avoiding information fatigue
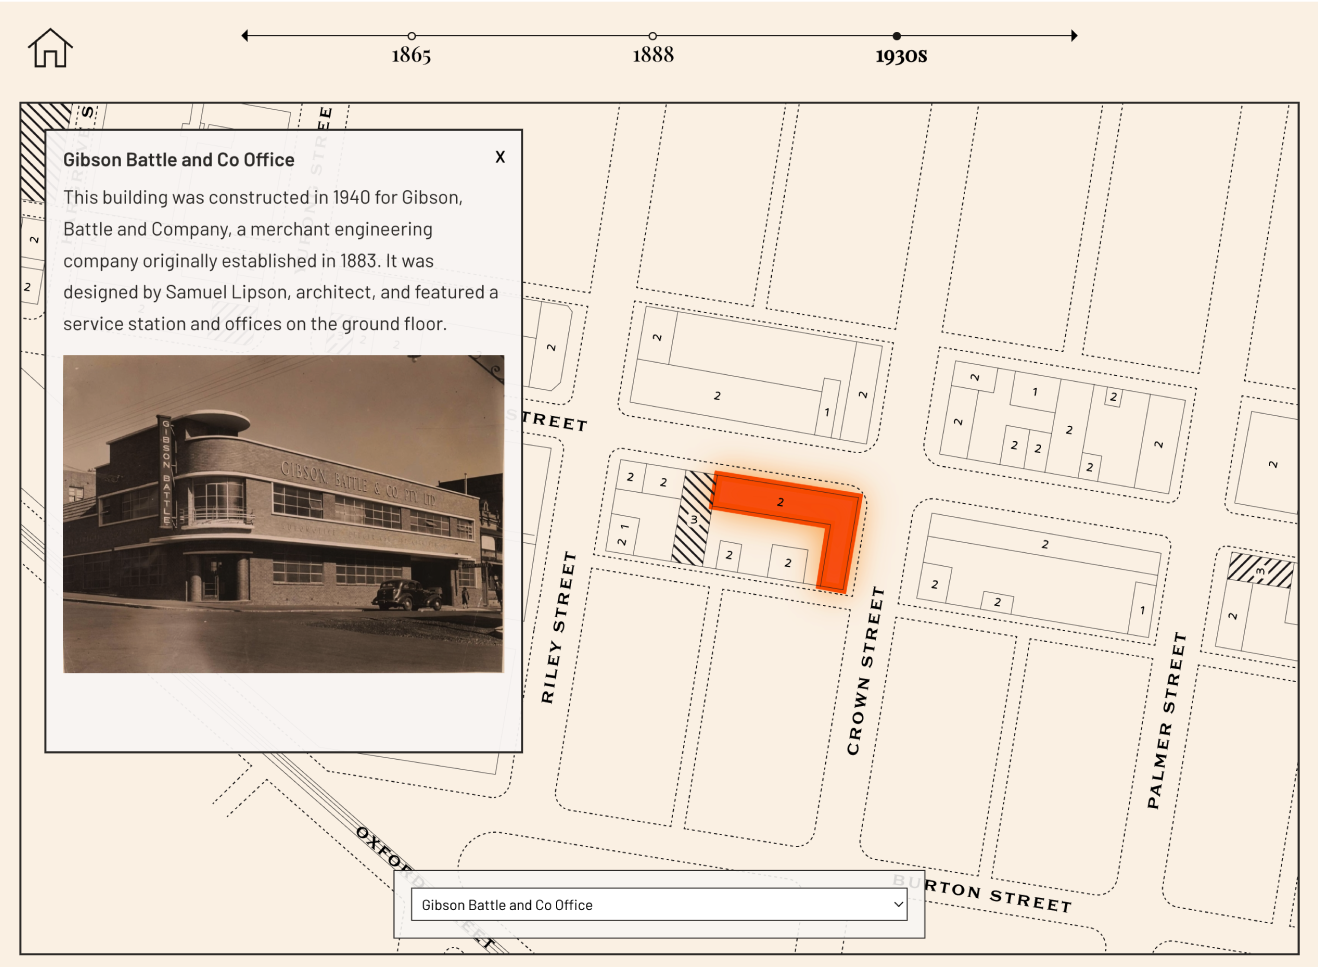
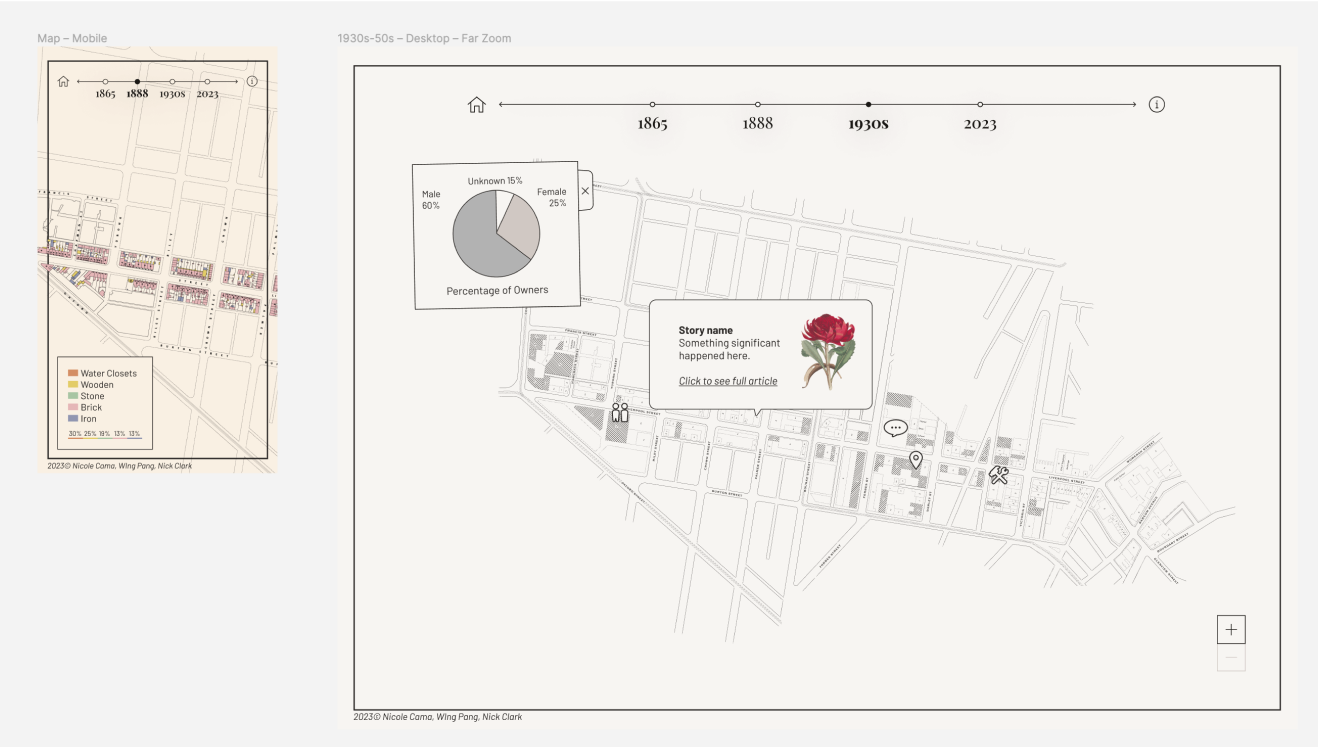
To avoid information fatigue, data is visualised in an interactive way, where users can click on ‘points of interest’ on a map to view stories that they’re interested in.
Tying information together from separate time periods
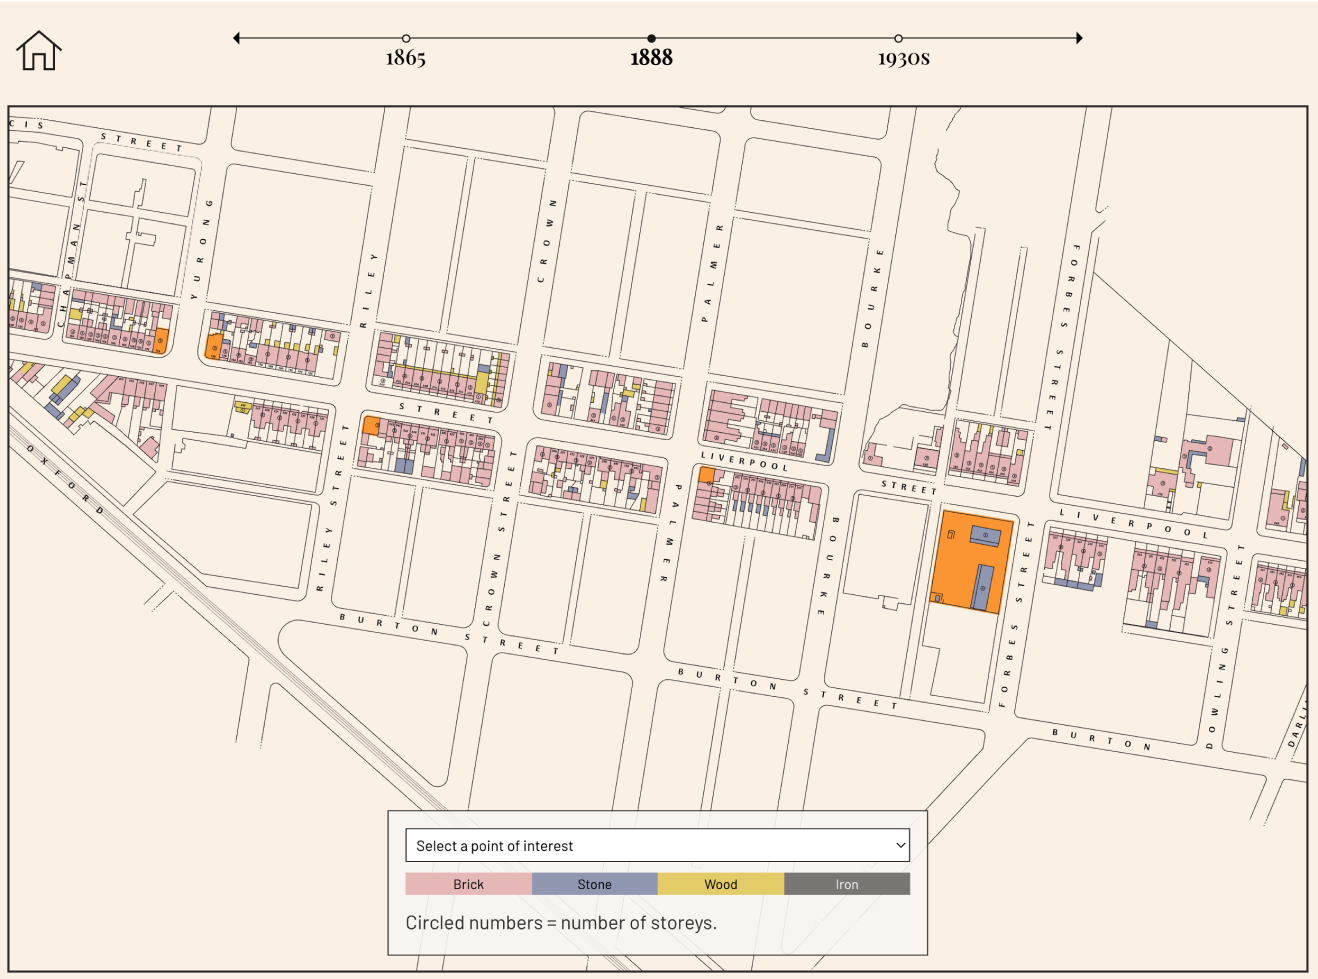
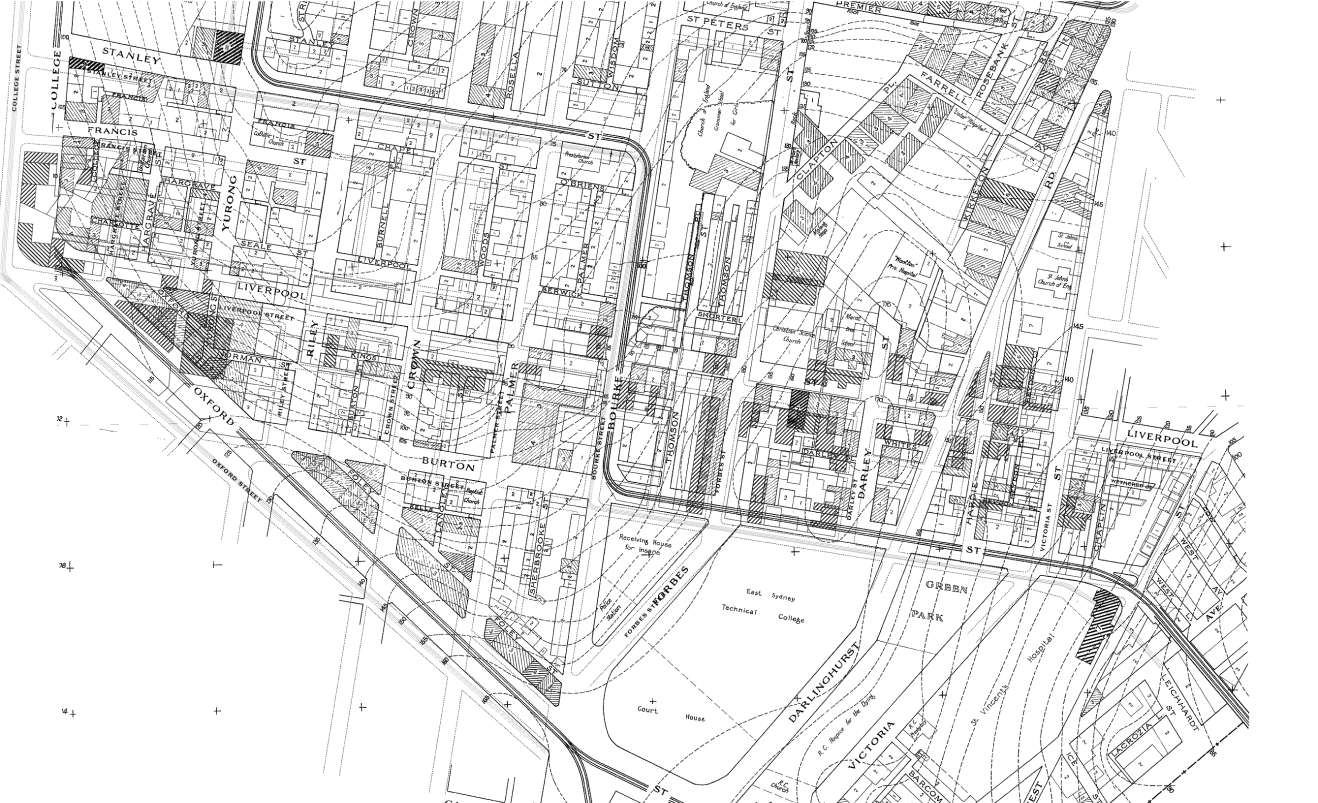
In the main map section of the project, users can flick through vectorised versions of archival maps from different time periods and compare the changes throughout Liverpool Street.
Incorporating archival images
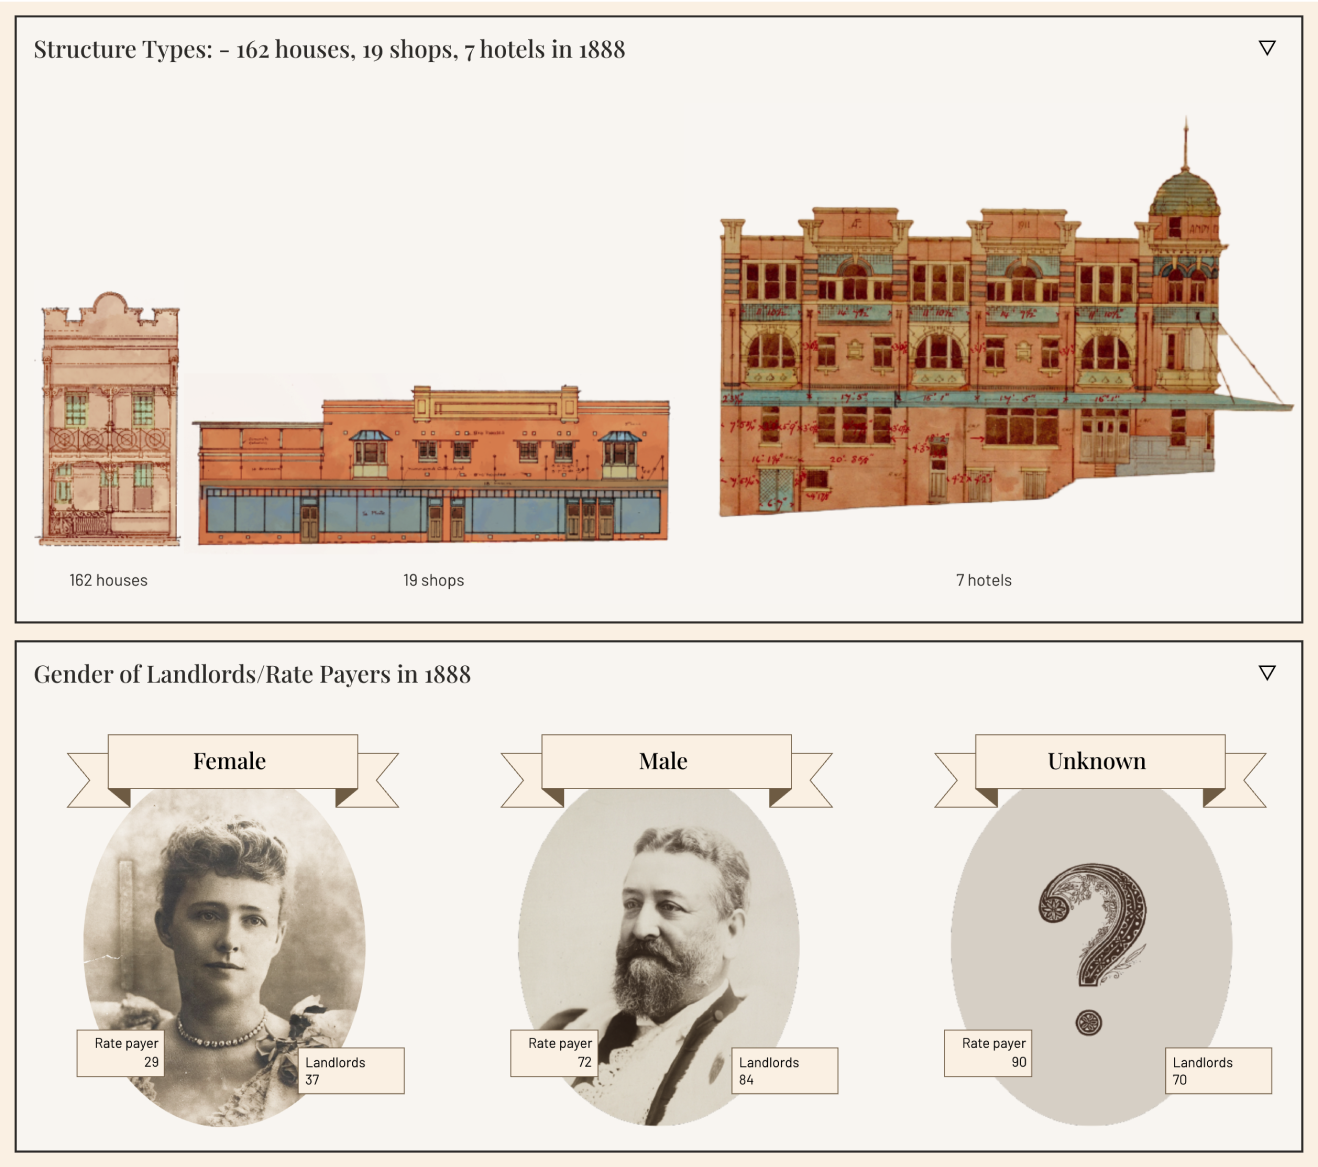
Archival images paid an important role in tying the project together visually. They also served as icons for data visualisation. Elevation technical diagrams where also used as a visual cue for what certain types of buildings may have looked like in the past.
5. Design process
Brainstorming
I brainstormed some initial ideas in a list format, but a lot of these ideas were changed throughout the project due to technical or usability reasons. The process of design and iteration for this project was very agile and cyclical, targeting problems as they arose.
Some initial ideas in the reply:
- Vectorising/tracing and splitting the historical survey plan/map into different sections
- One of the sections will feature the following:
- Illustrations of different types of building on Liverpool St from a front-on perspective with colour coding + key for the various materials used in the original construction plans
- Thinking that in order to show the datasets in an interactive way, information can be overlapped on the aerial map of Liverpool St.
- Similar to aerial view Google Maps, but information that’s overlapped changes depending on the “filter” the user selects
- Filters might be the building fabric + gender proportions
- Building fabric might be a toggle-able overlay on the map that colours the buildings depending on what it’s made of + a key that explains what each colour represents. I'll need a bit more clarification of what the dataset exactly includes, I think.
- Maybe gender proportion can be represented through pedestrian icons on the map, with a pie chart in the corner of the map for clarity
- It would be interesting to have some of these icons be clickable to view stories of people with their portraits
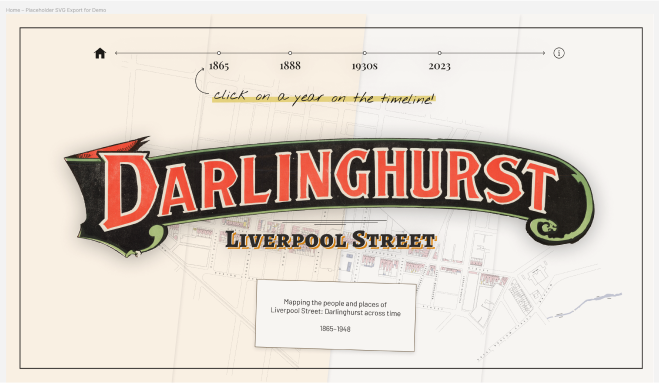
- To show how the street transforms over time, maybe there could be a scrollable timeline where the user can see how the map changes depending on what year they’re on
- A bit like this: Google Earth Engine but at a smaller scale and with illustrations instead of satellite images
- The overall style of the project will use an ink-like illustration style with a sepia tone similar to the documents shown.
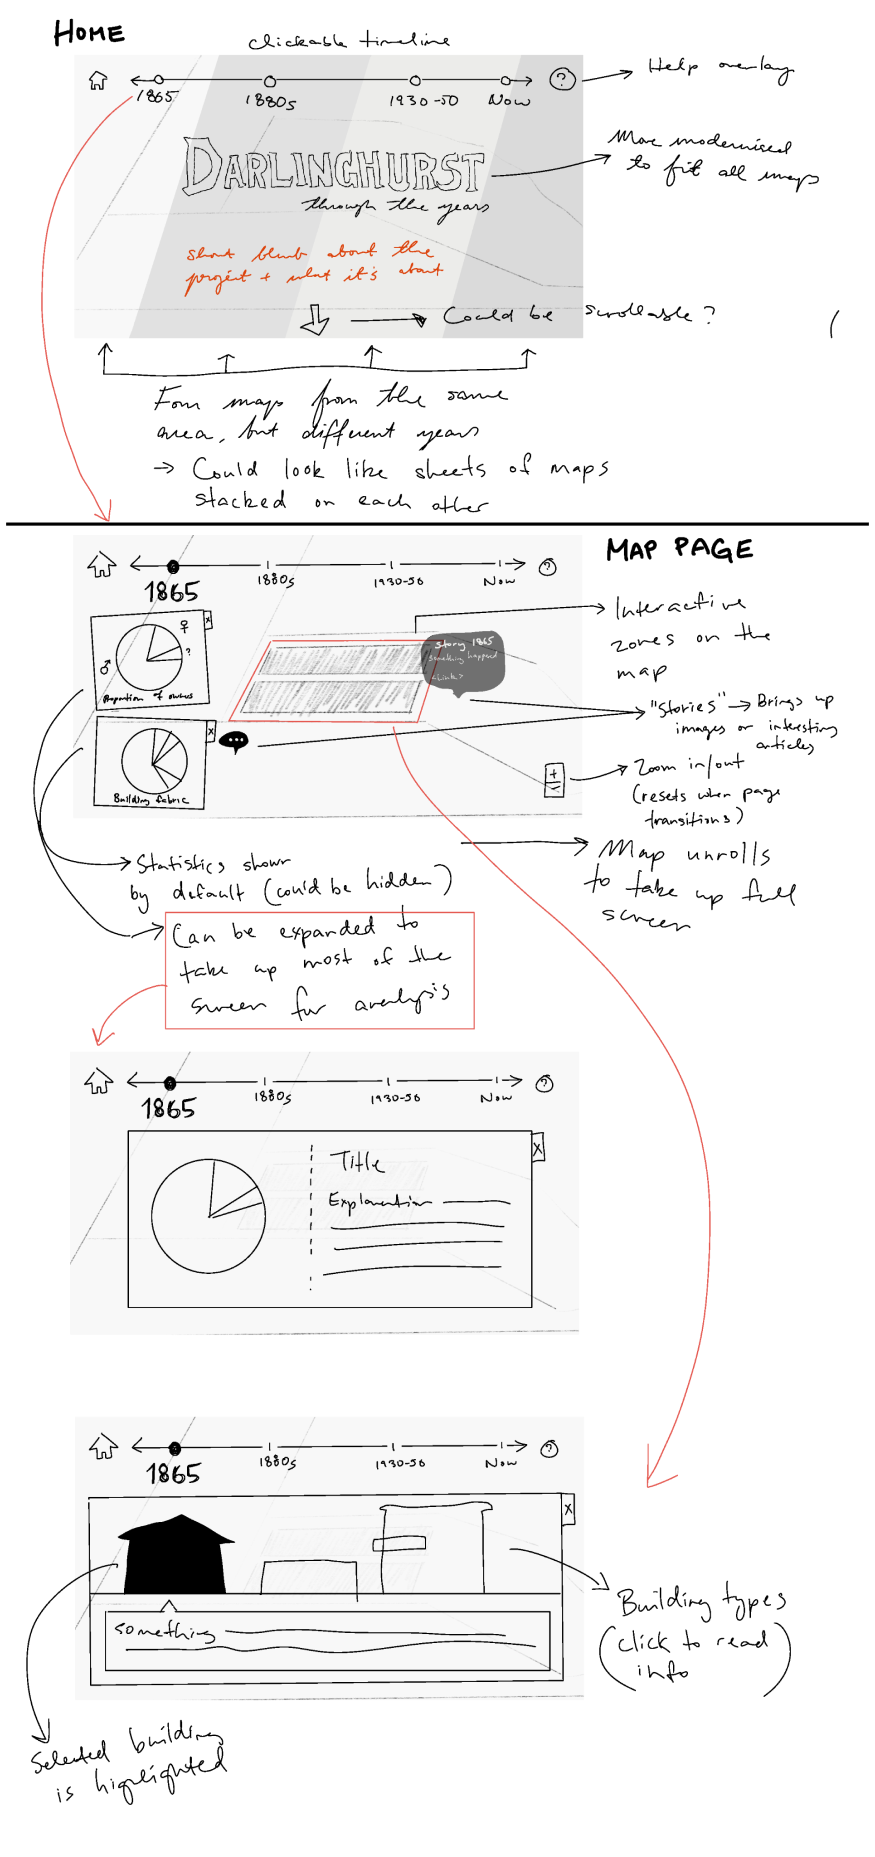
Sketching
The initial sketches for the project looked very different to how the site looks now. These sketches had more reliance on overlays and popups, which ended up not being a good idea for the amount of information we ended up having. However, some aspects like the timeline and graphical style carried through.
Iterations
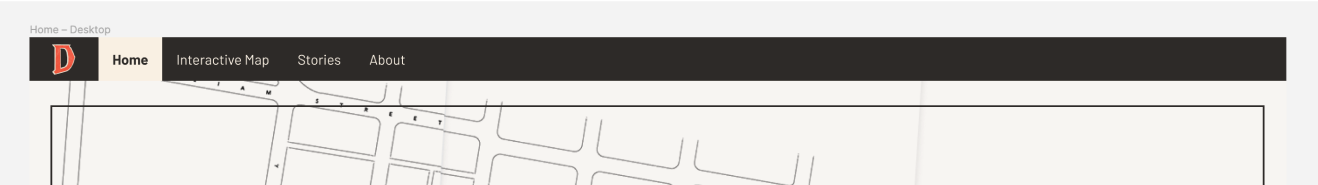
The first iterations of the site was a single page site with only the map as focus. However, as the project's scope expanded, the designs were revisited to match the new content.
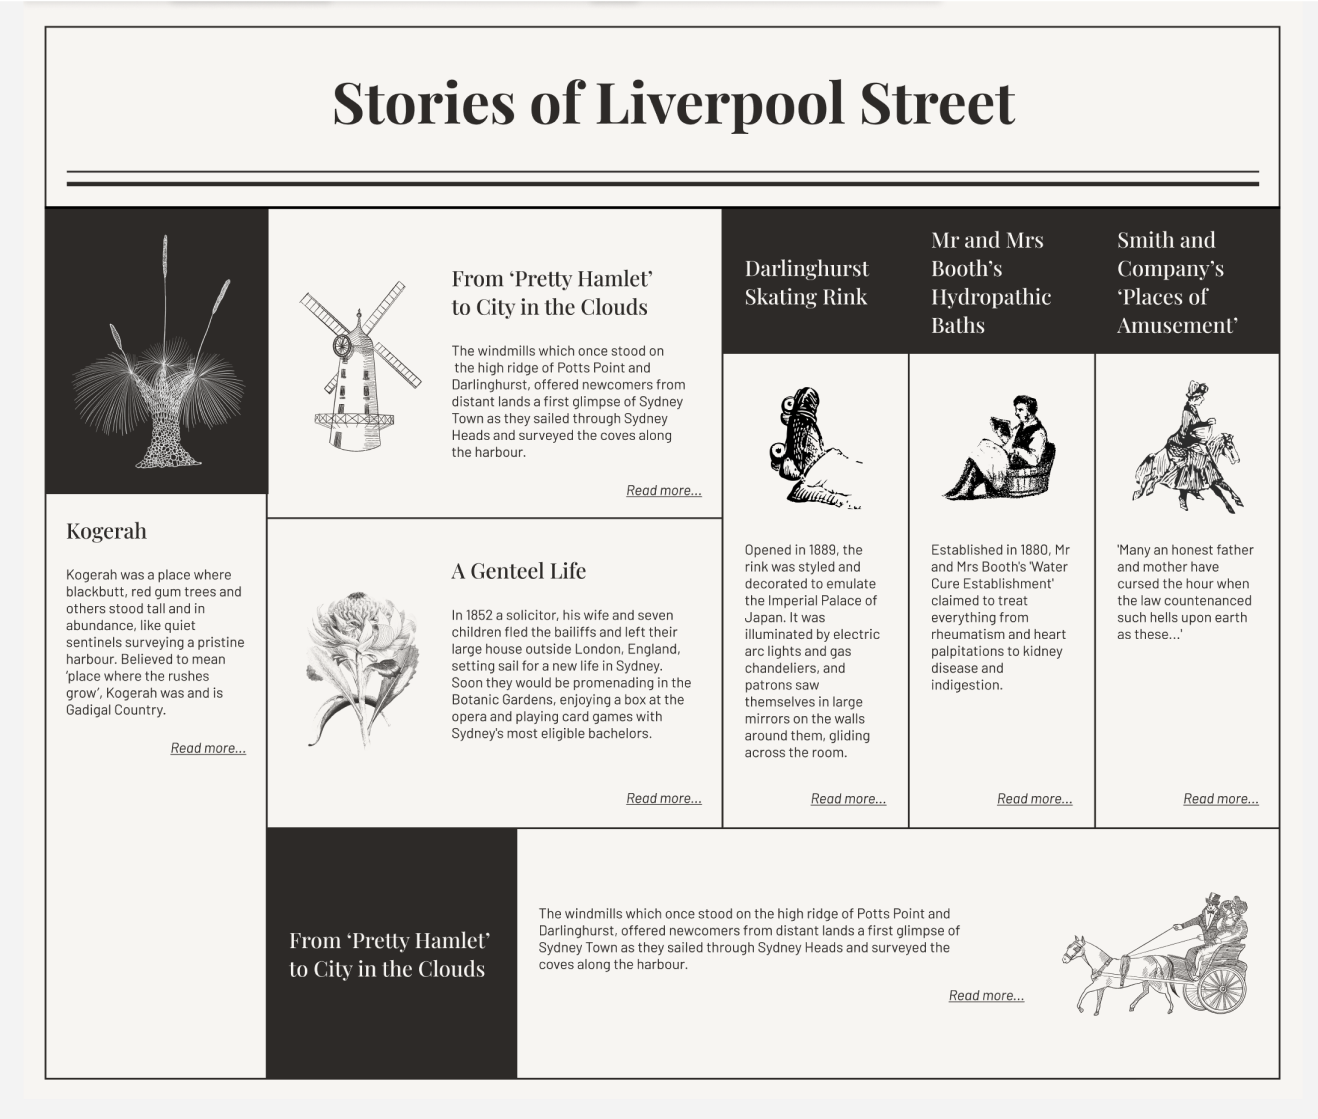
Nicole and Nick implemented the Stories, Street Data and About pages, I helped with styling the Stories Pages using CSS in the front-end. The addition of these pages meant that a header was needed to bring the site pages together.
An alternative layout for the stories of Liverpool Street was also designed for the home page but wasn't implemented in the end. The icons of the stories were derived from archival images provided by Nicole. Some of the icons were hand-illustrated for consistency since there weren't any inked archival drawings available.
6. Challenges
Tracing the maps
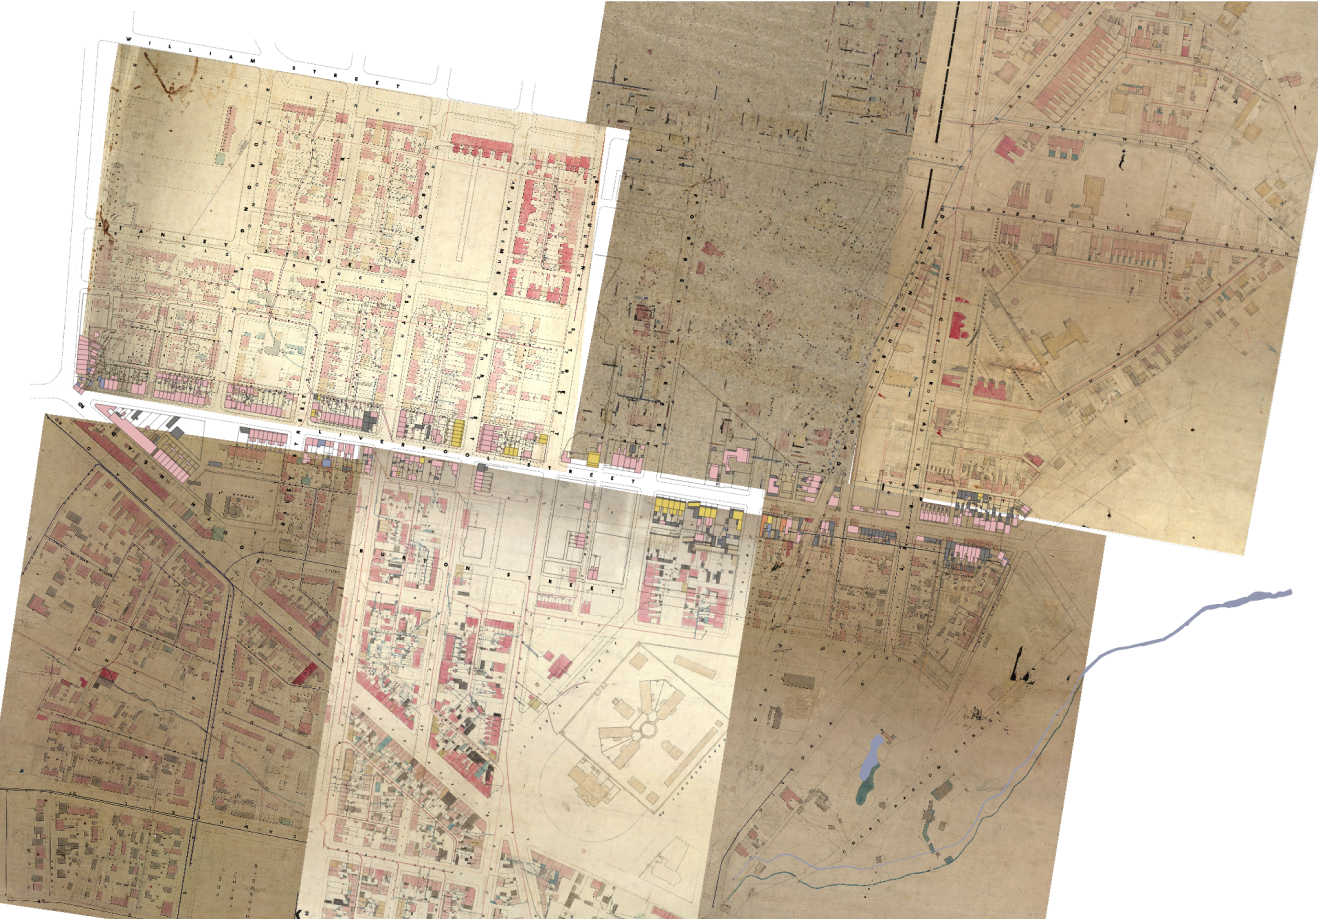
One of the biggest challenges in this project was vectorising existing archival images so that they could overlap and allow for easier visual comparison.
It required piecing large scanned map images together in illustrator, and tracing buildings on the street by hand.
Expanding scope and time management
Since the size of the project exceeded what I had originally thought it would be (a single webpage), time management became difficult as I juggled university, a part-time job, and other professional commitments.
This meant that some features that would’ve been nice to be implemented ran out of available time/budget for. (E.g. scroll animations, grain textures and page transitions).
Nonetheless, I’m grateful to have been able to work on this project with the amazing Nicole Cama and Nick Clark.
7. Learnings
Sometimes, design is messy and non-linear
While we can do our best to work in an organised design process, sometimes things change during the project which will require us to adapt and think on the spot.
For example, the implementation of the stories tab had a quick turnaround time, which meant that the blog format was already coded before designs were made. By using my knowledge in SASS and HTML, I was able to help style the site to look coherent efficiently.
Communication is key
In the beginning of this project, a lot of the communication was done through email only. I found that once we were able to organise a time to call and talk the project through live, ideas started flying and we had a place to start our work.
8. Final comments
I absolutely loved working on this project! The topic of local histories is so interesting and I really enjoyed chatting to Nicole Cama and Nick Clark about fun trivia tidbits surrounding Liverpool Street.
As the project came to a close, it got me thinking about how there could be so many stories and secrets hidden away from us in plain view. I hope that this project could help spark some curiosity in researching the streets that surround you!